Finally, real customer intelligence.
Context for your customer feedback is buried deep in text data from a dozen different sources. Kapiche simplifies how you unlock this goldmine of data from any source, for contextual customer insights that your company can actually use.

“Kapiche not only analyzes the written responses but suggests themes in responses to help you understand feedback that you might be missing and the impact of that feedback. This means that you don't need to spend time 'training' the system to recognise themes and concepts in your data.”
Executive Sponsor, Mid-Market (50-1,000 emp.)
Analyze customer feedback data with no set up, no manual coding and results you can trust.
Thousands upon thousands of customer comments per month. Feedback from a dozen different sources. Countless days and weeks spent analyzing data and still no concrete answer for how to improve your CX. Until Kapiche.

Price? But what about Price?
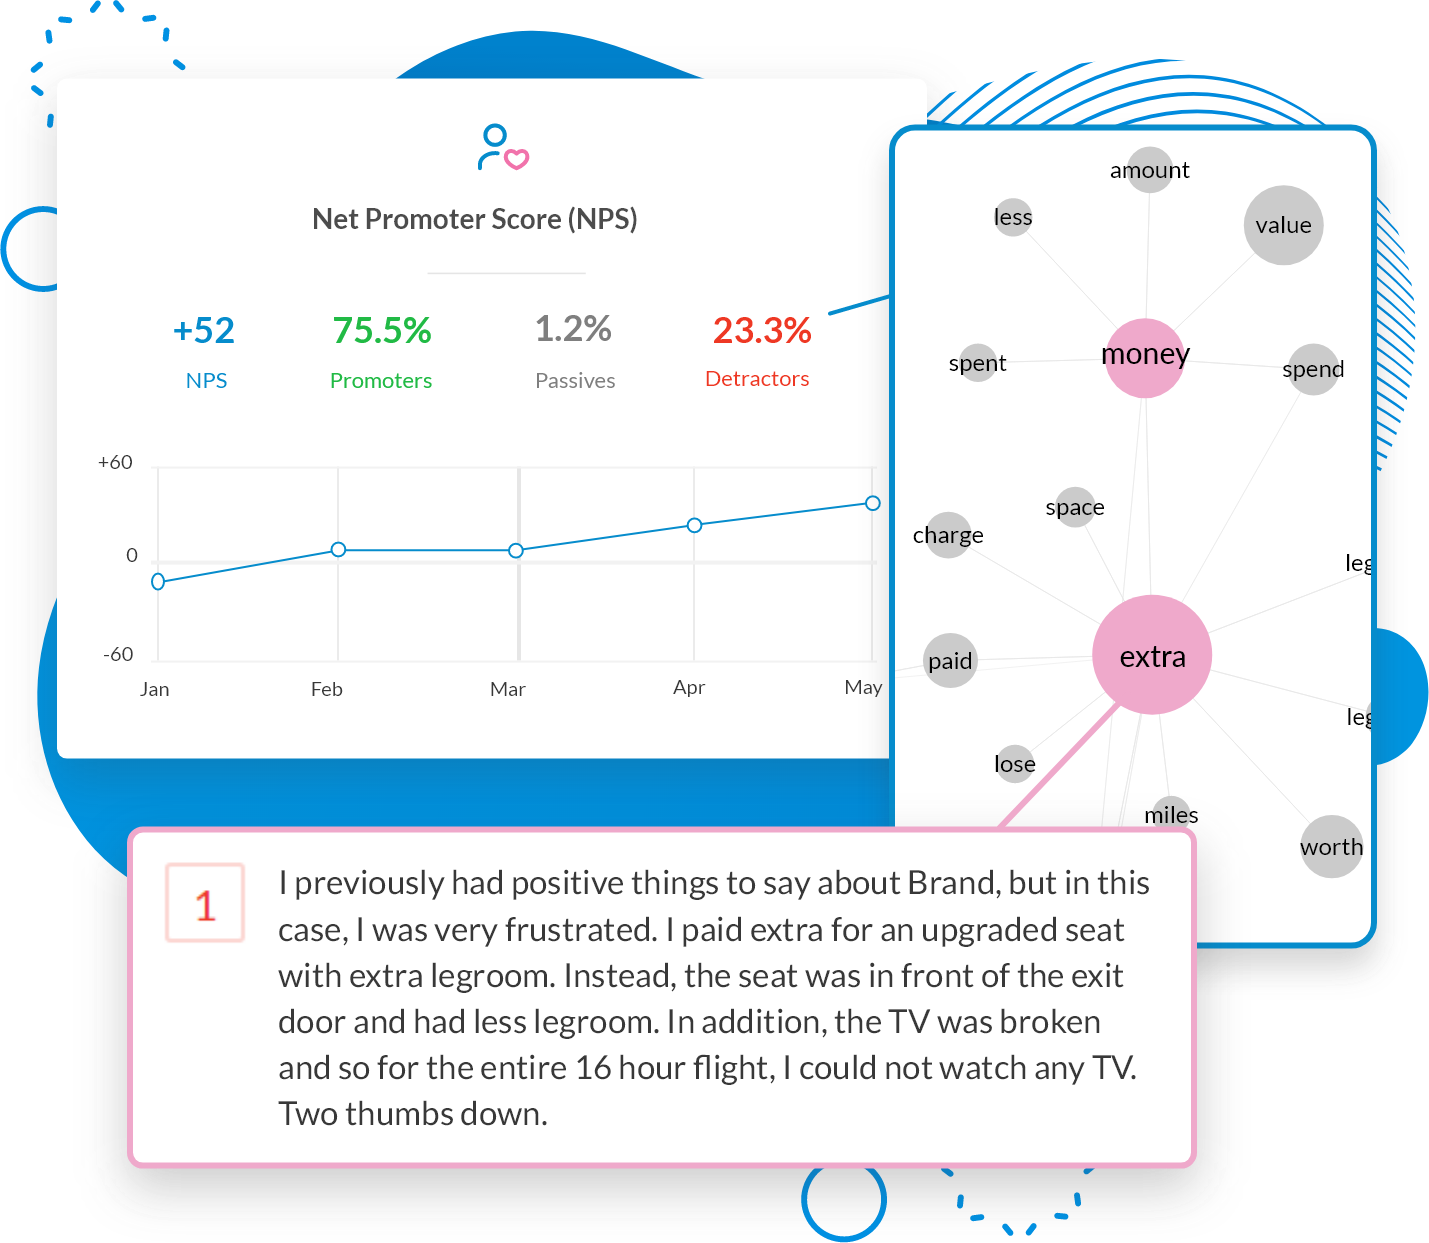
You spend endless hours manually-coding or reading hundreds of customer comments, yet you never seem to find truly actionable insights. The context you need is buried under basic themes like price, quality, and shipping. Get the deep contextual answers you need using Kapiche’s Dynamic Context Network.
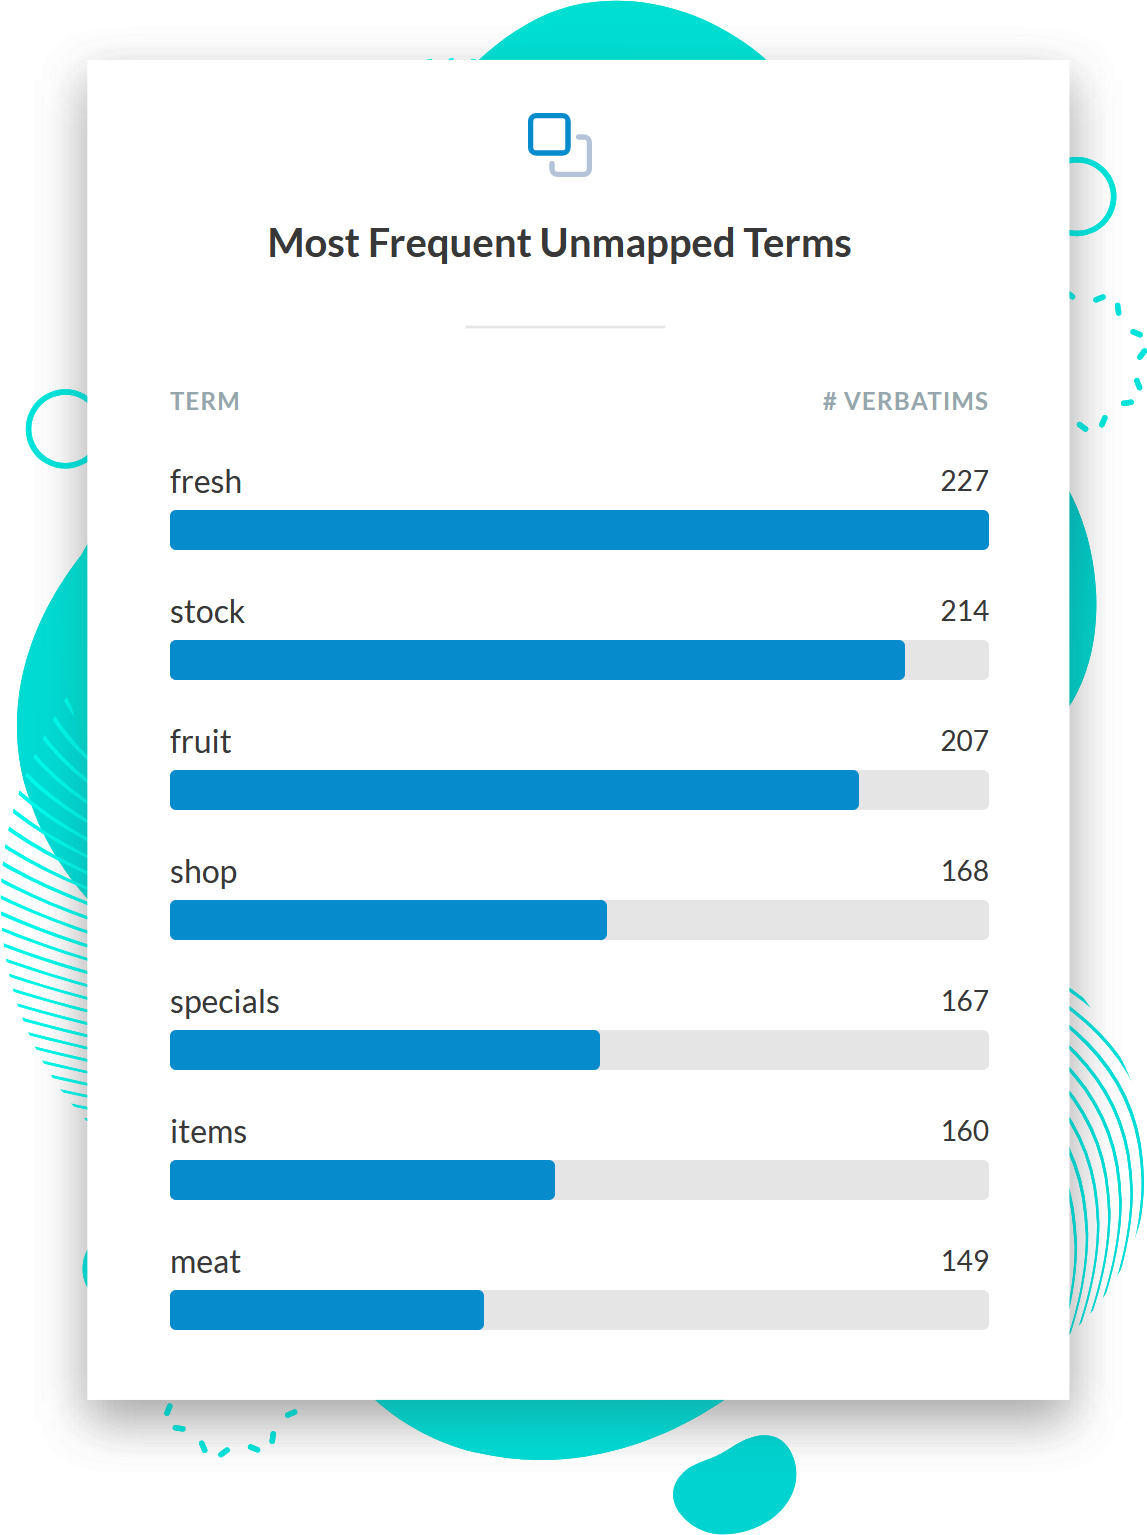
Automatically spot emergent trends, before it gets ugly
Trained industry models and manual-coding only give you half the picture. What happens when new issues arise that you don’t yet know about? Using natural language processing, you can automatically identify these emergent themes with Kapiche’s unmapped records tool, to stay ahead of your customers and deal with the right now.
Easily understand how to improve CX metrics
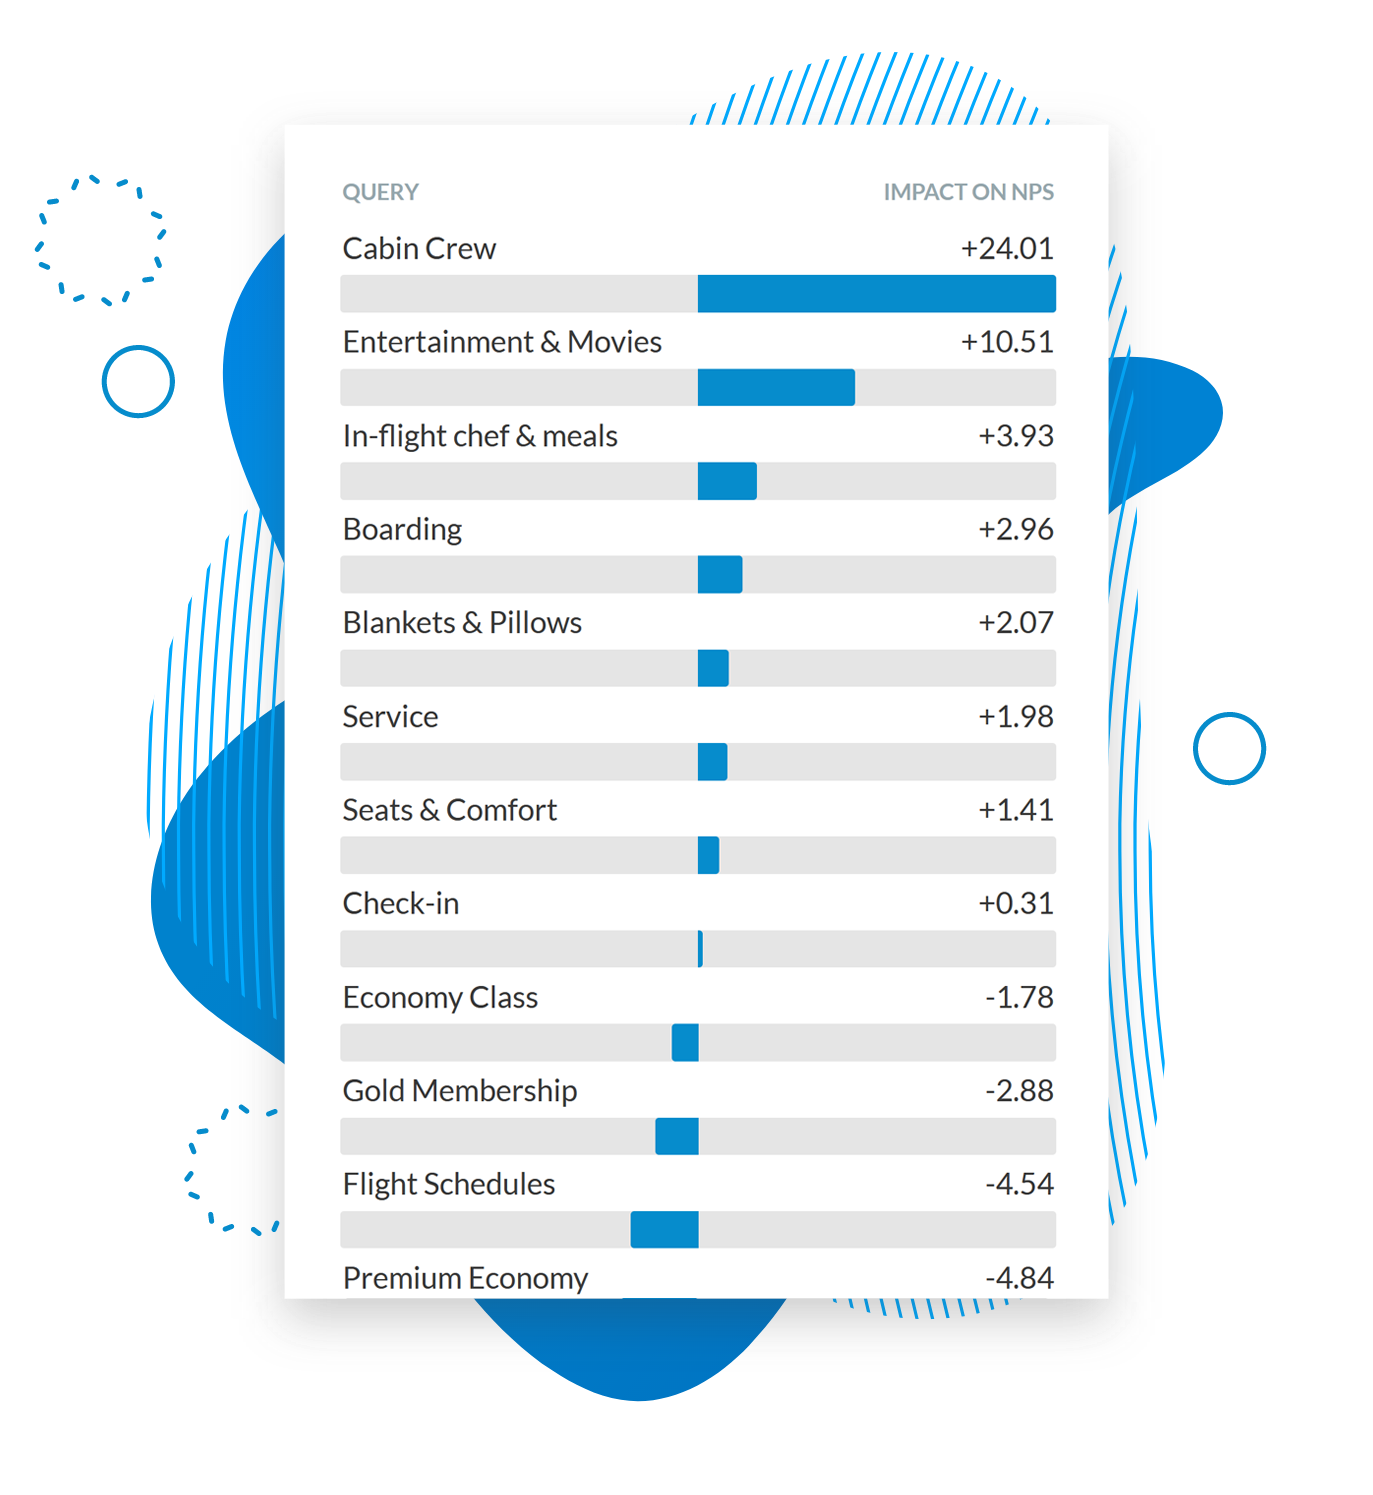
Price too high. Quality too low. Response time too long. Checkout experience sucks. How do you choose which customer issue to work on? Which will have the greatest ROI?
Kapiche impact scores tell you exactly this. Quickly see the customer issues that need prioritizing and understand how fixing these will boost your scores.
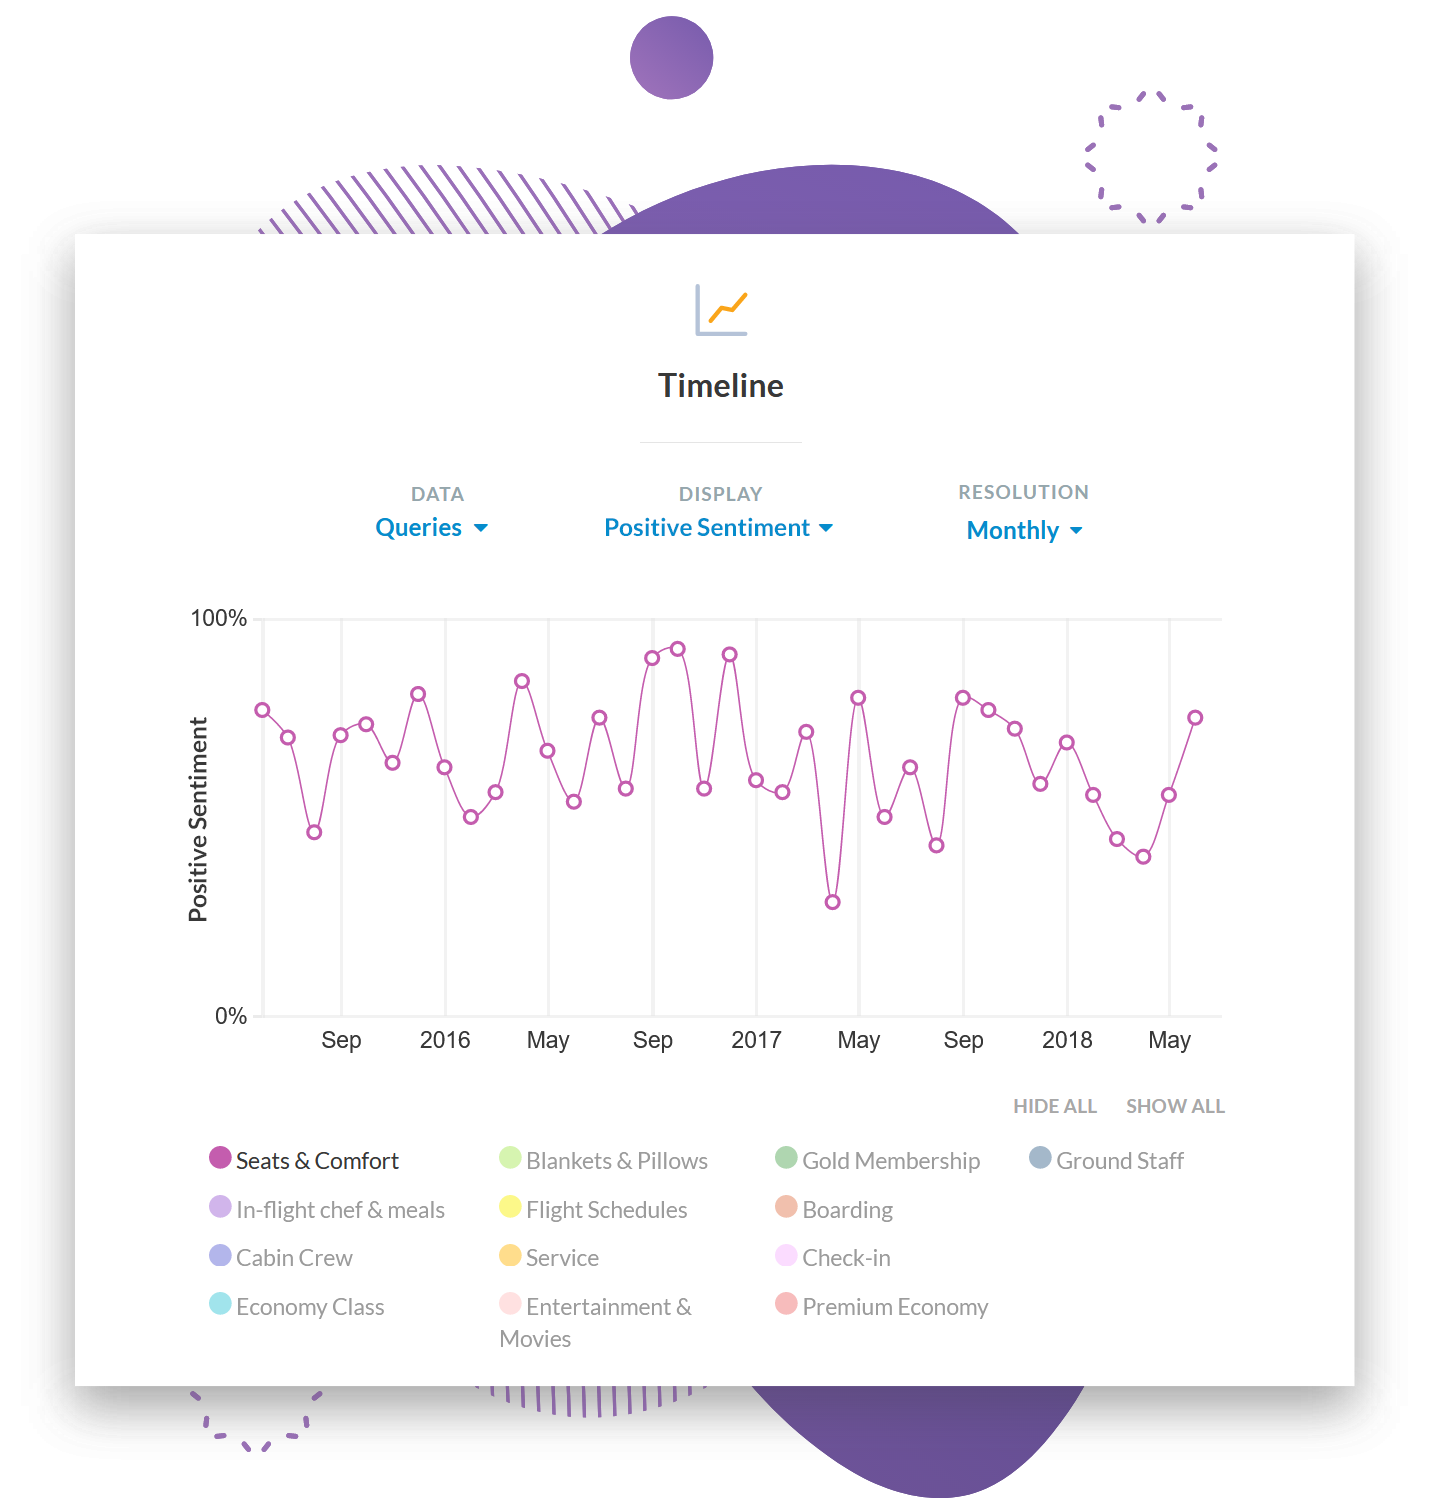
Track issues and trends over time
You’ve finally implemented strategic changes based on the insights you’ve uncovered, but how do you know if these issues have been rectified in your customers minds? Now you can track the effect of your business decisions on customer satisfaction using the Kapiche timeline tool.
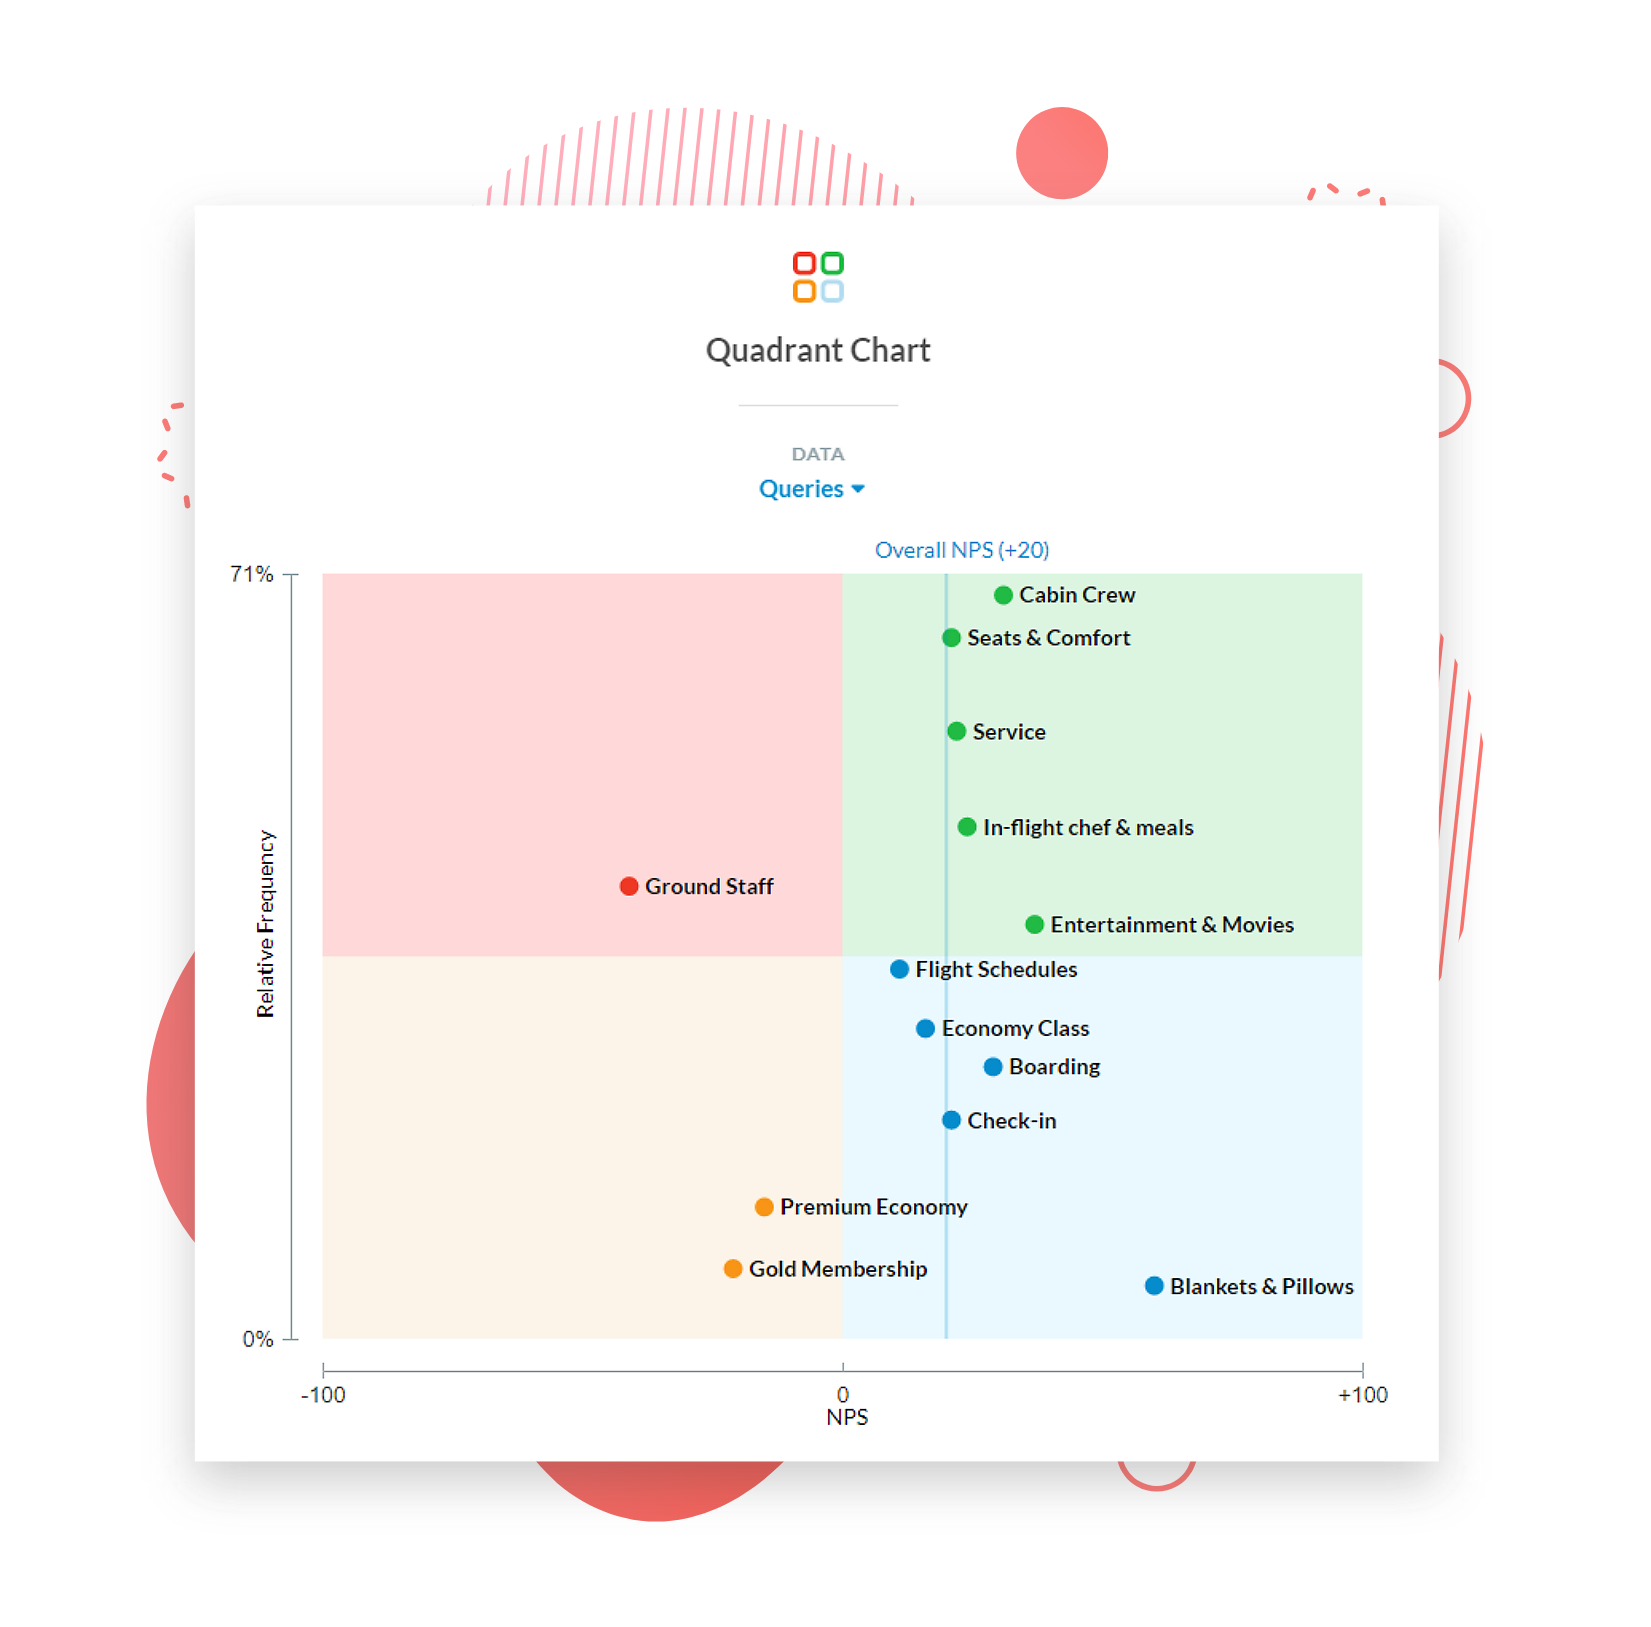
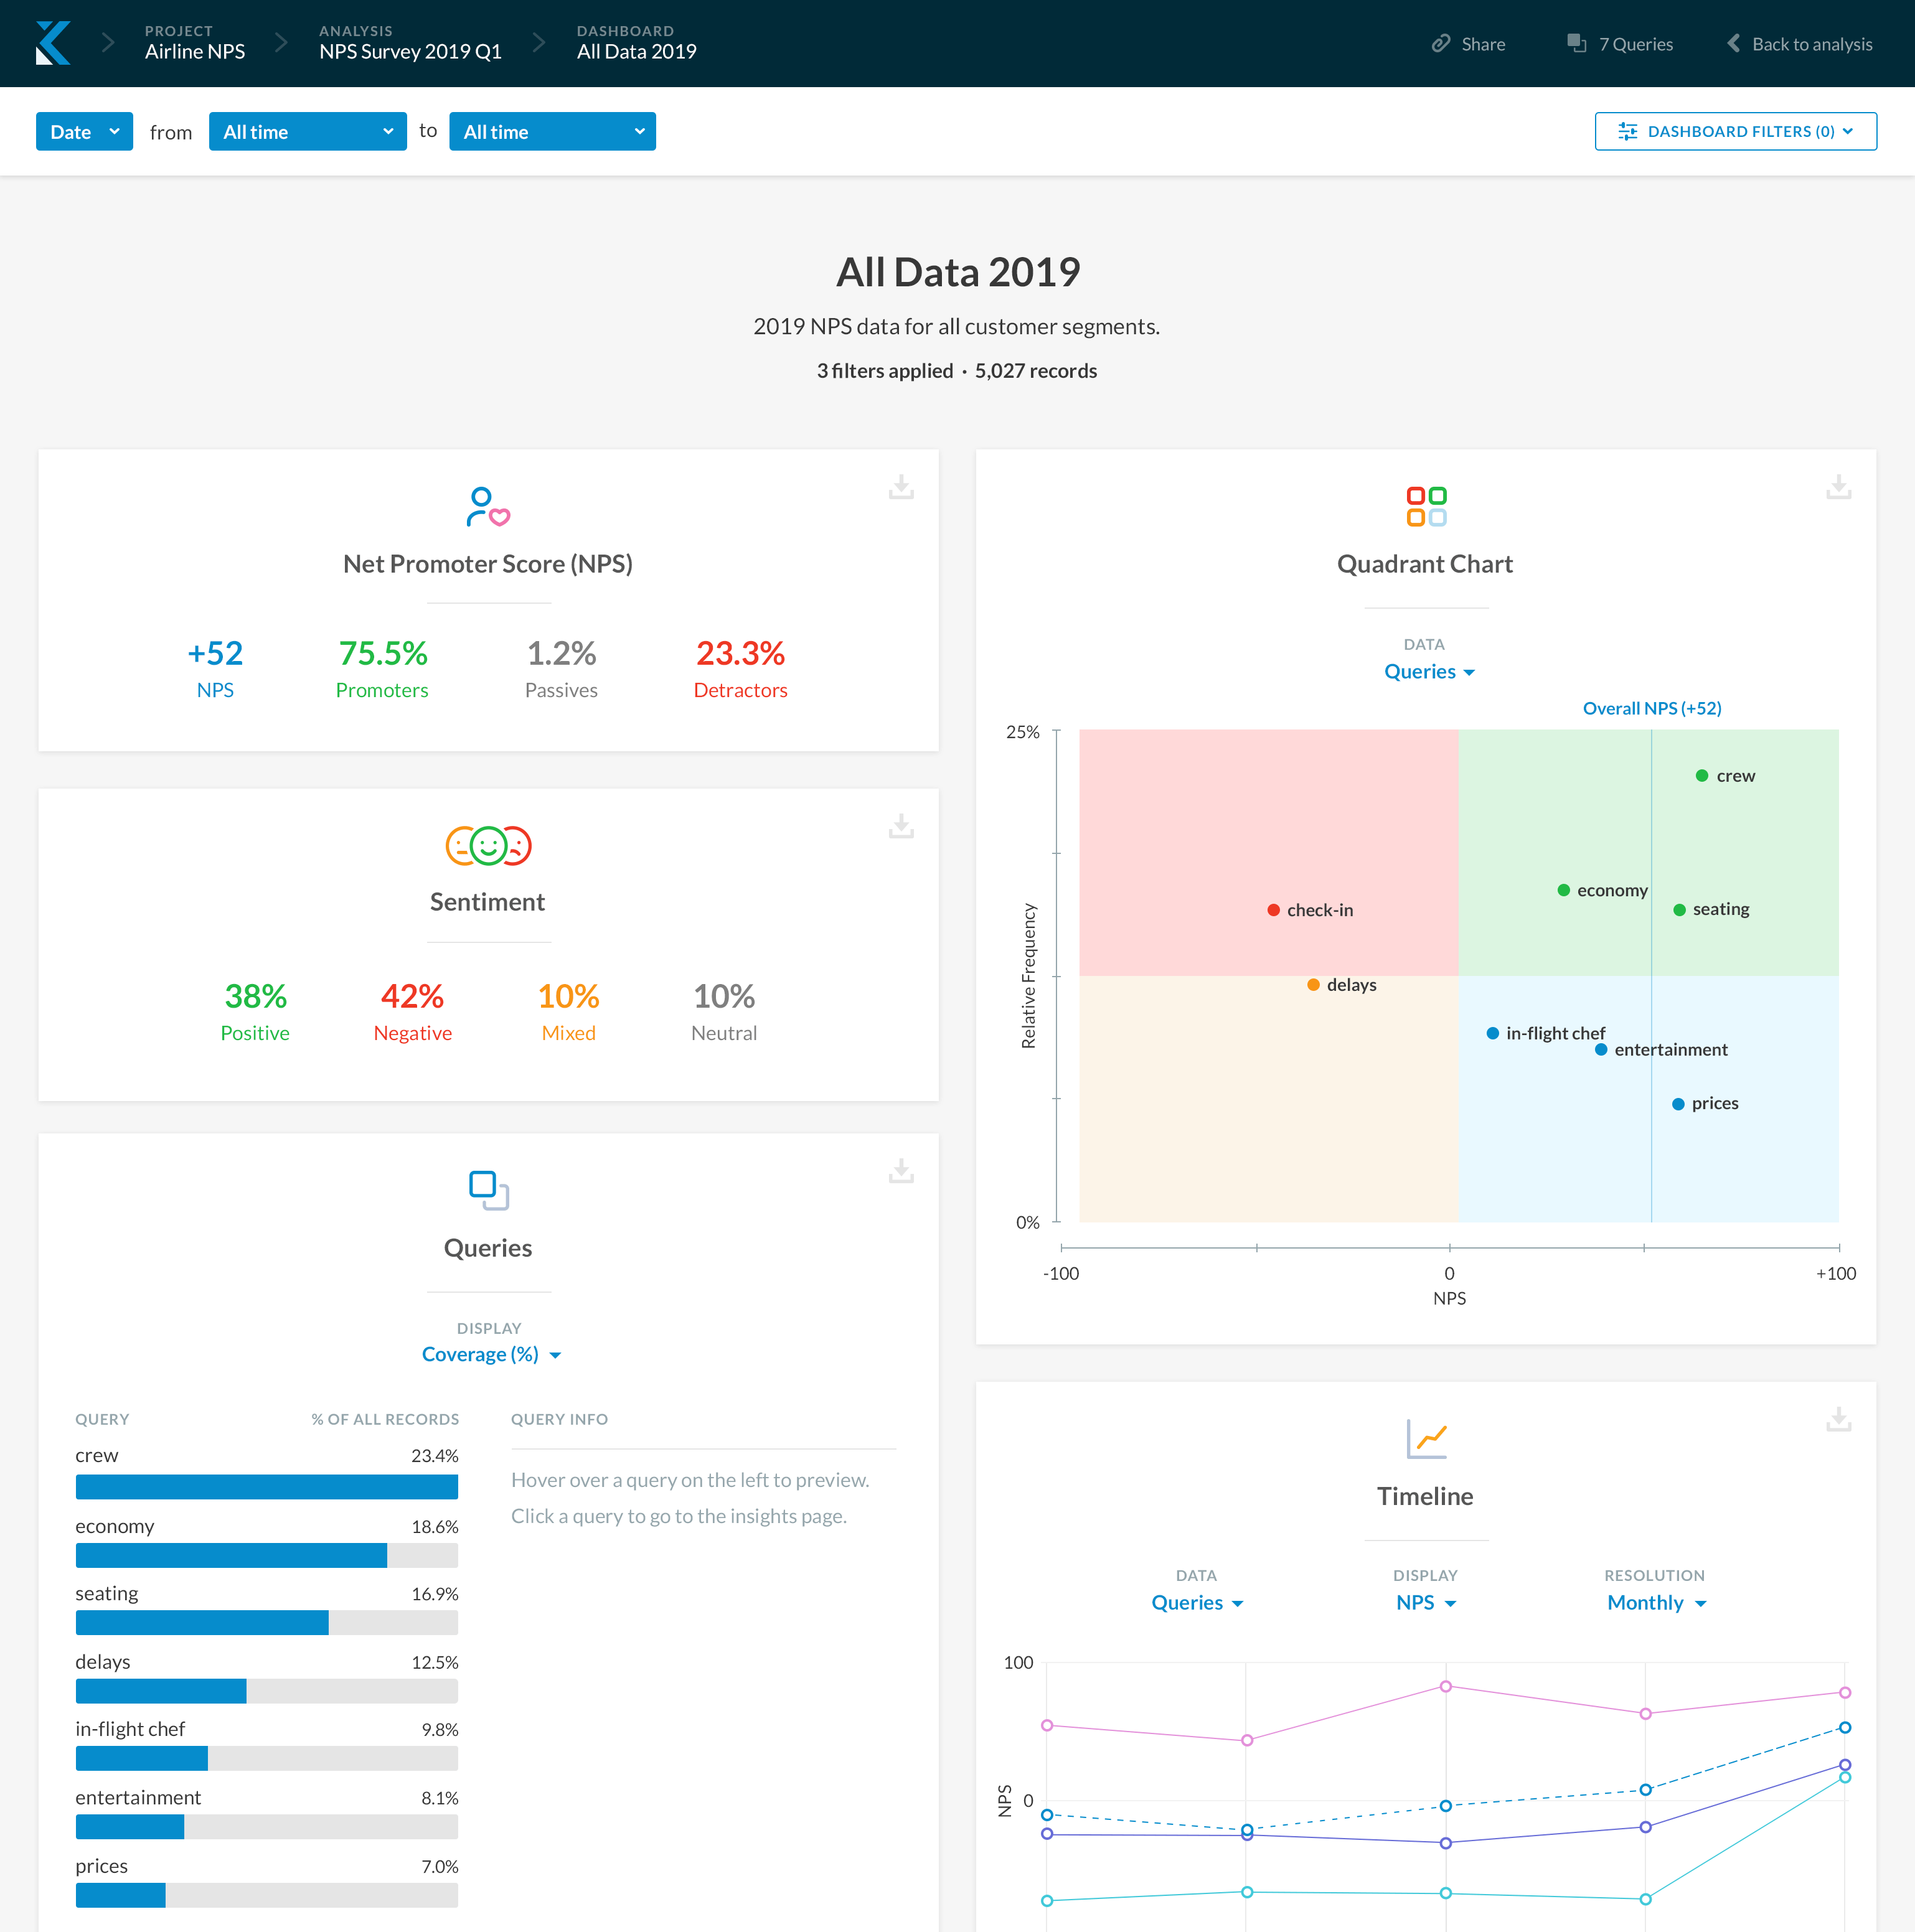
Deeper insights at a glance
You've got your trusty manual model in Excel or the big survey tool that promises survey data analysis. Problem is, you’re still unsure what issues need prioritizing.
The Kapiche Quadrant Chart will instantly pinpoint how different themes or customer segments are performing, so that you can prioritize initiatives accordingly.
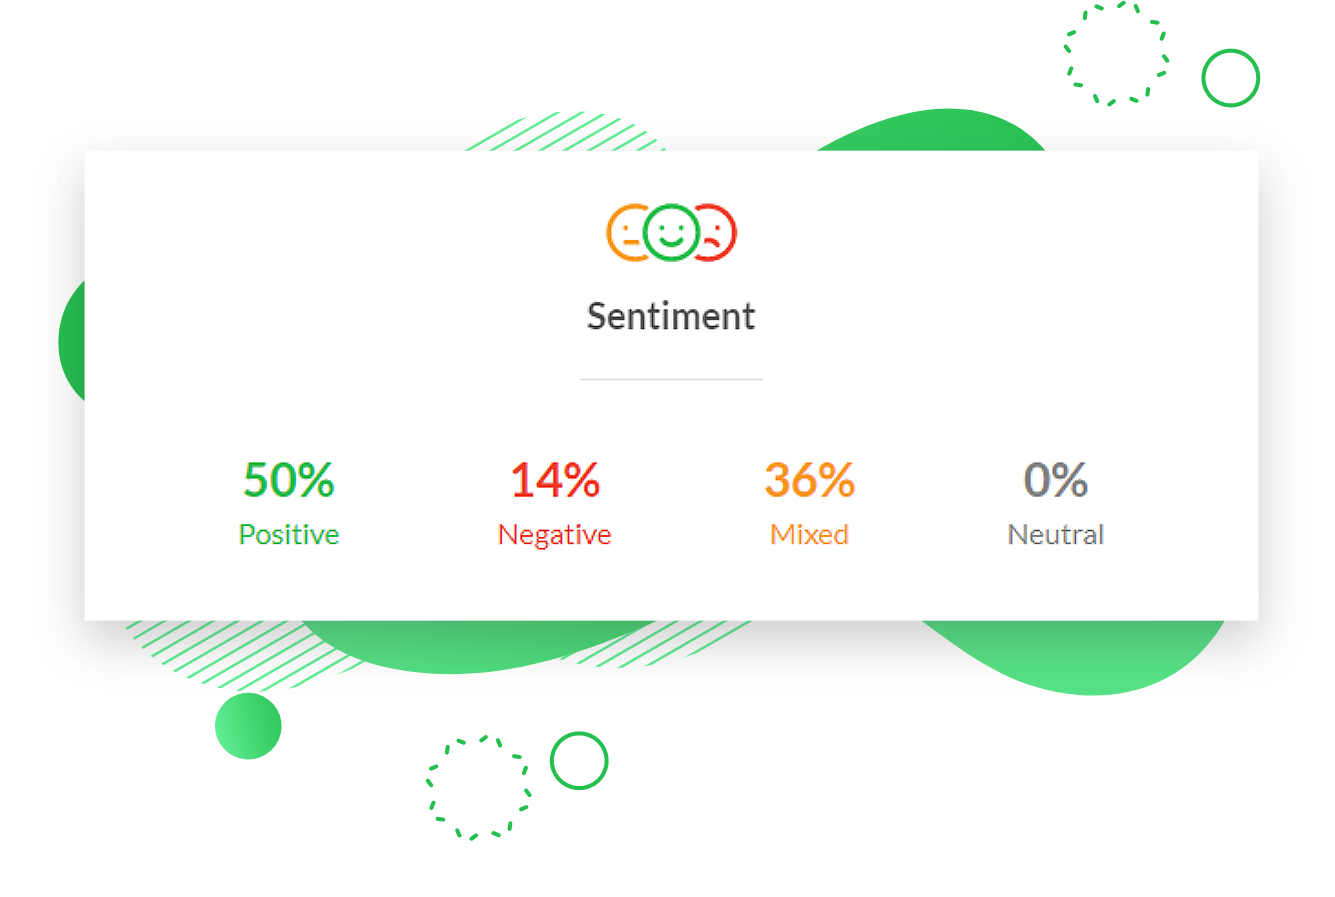
Happy, sad, and everything in between
They love the UX. They hate support. They’re angry, happy, indifferent but mostly love your product.
Understanding human feedback is hard. Kapiche's sentiment tool adds an extra dimension to your unstructured data analysis, giving you deep insights into the thoughts and feelings of your customers.
Insights in the right hands, at the right time
Ok, so you’ve got the actionable insights from your unstructured data. Now how do you get them in the hands of the right people, at the right time, for change that actually moves the needle on your customer experience? Kapiche dashboards, of course.
Add data from any source into Kapiche
Kapiche integrations allow you to bring together demographic, behavioural, spend and CX data from disparate systems such as CRMs, survey tools and cloud storage providers for even deeper insights.

“The tool is brilliant ...it allows users to quickly and impartially understand key concepts and themes residing within large open-ended data sets. Time saved can be better utilized performing analysis of key themes and sharing insights with stakeholders through the custom dashboarding tool. ”
Steven Hill, Senior Manager - Voice of Member, RACWA
It’s time you got more from your voice of customer data
Be the data hero you always knew you were.